The first two setups in this series answered one question: is the level holding? Absorption said yes or no, the COT Flip confirmed the direction, and zone volume scaled the conviction. What none of that shows is who is doing the holding.
That is the third axis. A level defended by a handful of small orders and a level defended by repeated 100-lot prints are not the same level, even when the absorption flag looks identical. mzBigTrade puts the individual trades on the chart, filtered down to the ones that matter, so you can see the size standing behind a hold. We call a level with visible size behind it a Defended Level.
The level itself comes from the setups you already know: an imbalance S/R zone (Mirror Levels) or a POC (POC Retest). Defended Levels does not introduce a new level. It adds the who.
What defense looks like
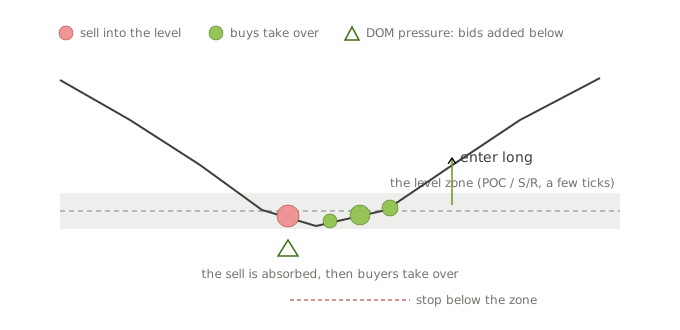
The core read is simple: big prints cluster at the level while price stops advancing. Aggressive size is hitting into the level and the level is not giving way – someone is eating it. But the prints are not the absorption flag at finer resolution. In the real cases they sit around the absorption event, before and after it: the attack comes in, the flag marks the level being held, the initiative follows. When the bounce comes, you know who was in that sequence.
Defense often reads in two acts. First the attack is absorbed: aggressive size hits the level and gets eaten. Then the defending side turns initiative: the side that was passively eating starts hitting the market itself and pushes price away from the level. The first case below shows both acts inside five seconds.
This is also why the two tools read different things. Market structure builds along two axes: price and time. The footprint reads the price axis – zones, levels, the absorption event at a price range. mzBigTrade reads the time axis – who came, at what size, in what order. A defense is a sequence in time at a place in price, and it takes both lenses to see it whole.
Three reads, from direct to hidden:
1. Big prints at the level
With mzBigTrade in Default presentation, filtered trades attach to the bars at the price where they traded. A series of large prints into the level, with price holding, is size defending it. The prints do not decompose the absorption flag – they show who came around it: how many, how big, which side, before and after.
2. Icebergs – the hidden defender
An iceberg is a large limit order showing only a small visible part: aggressors hit it, it refills, price does not move, and volume at the level keeps growing. This is the classic institutional defense pattern, and it is invisible on candles by design. mzBigTrade detects icebergs with two algorithms (Hard and Soft) and can filter trades by iceberg volume.
Alongside icebergs, mzBigTrade tracks what the visible book did while each trade executed: the DOM pressure and DOM support volumes. Positive values are liquidity added during the execution; a negative value is liquidity pulled – displayed size that vanished the moment it was tested. The trade pop-up carries all four numbers for every trade: total / iceberg / DOM pressure / DOM support. The iceberg-defense case below is read entirely off that format.
One honest constraint: iceberg detection works on live data or Market Replay only. You will not see icebergs on a cold historical chart, so treat iceberg reads as a live-session tool.
3. Trades Volume Profile – the map of the defenders
The Trades Volume Profile builds a profile from only the trades visible on the chart – that is, only the trades that passed your filters. With a big-trade filter on, it is not a volume map, it is a map of where size concentrated. If the cluster of filtered volume sits exactly at your level, the defense is not one bar’s story: size has been active there repeatedly.
The profile is linked to the Marker size relative to parameter. Set it to Iceberg (with the iceberg filter enabled) and you get an iceberg profile: a map of where the hidden defenders sat. Icebergs on the offer side print as sell volumes, on the bid side as buy volumes.
Use the Trades VP as a confirming map, not as a level source. The level still comes from the imbalance zone or the POC; the profile tells you whether the big players have been living at that price.
The honest layer: size is not identity
A caution that matters more every year: a big print is not automatically an institution with directional conviction. Large trades can be algorithmic execution slices or hedging flow, and size without context misleads. Two things keep the read honest.
First, location. A 200-lot print in the middle of nowhere is noise; the same print hitting into your level while price holds is information. Defended Levels only reads size at a level, never size alone.
Second, the filters. mzBigTrade ships several that raise the signal-to-noise of what you see: volume is multiple of surfaces participants trading rounded sizes (100, 200, 300…), Smart/Predatory flags trades that eat all available liquidity at the best bid or ask, and Aggression filters by the tick range a trade swept. Each is a different fingerprint of intentional, rather than incidental, size.
And the series’ core lesson still gates everything: size on the wrong side of absorption is the stop-run trap from the Mirror Levels article. Big prints going through a level are a breakout, not a defense. Absorption first; the prints tell you who, not whether.
What the cases look like
All three cases are real ES 14 Range examples.
Defended hold: absorption, then initiative
This is the same 9:40 long at the RTH POC (7500.25) from the POC Retest article. The footprint there showed a strong positive-delta bar, a large positive COT Low, and a sell absorption on the level. mzBigTrade shows who was behind it, print by print, with timestamps.
The attack: at 09:40:01 a sell of 86 lots hits 7500.5-7500, at 09:40:02 another 71 lots at 7500.75-7500.25. Over 150 lots sold into the POC inside two seconds, and price does not break. The cyan sell absorption fires at the level: limit buyers are eating it.
The initiative: at 09:40:03 a buy of 50 lots prints at 7500-7500.5, at 09:40:05 another 50. Round lots, hitting up through the same prices the sellers just failed to break. The side that was passively defending turns aggressive, and price lifts off the POC.
One more thing the trade pop-up reveals: each of these prints is a single market order reconstructed from dozens of small fills – the 86-lot is 74 fills, the two 50-lots are 42 and 43. In a raw time-and-sales none of them exists as a line. They are reassembled by the reconstructed tape, which is why this defense is invisible without the tool.

The defense through Preset B (min volume 50). The trade pop-up shows the whole sequence: sells of 86 and 71 lots into the level absorbed (cyan), then two 50-lot buys take the initiative and price lifts.
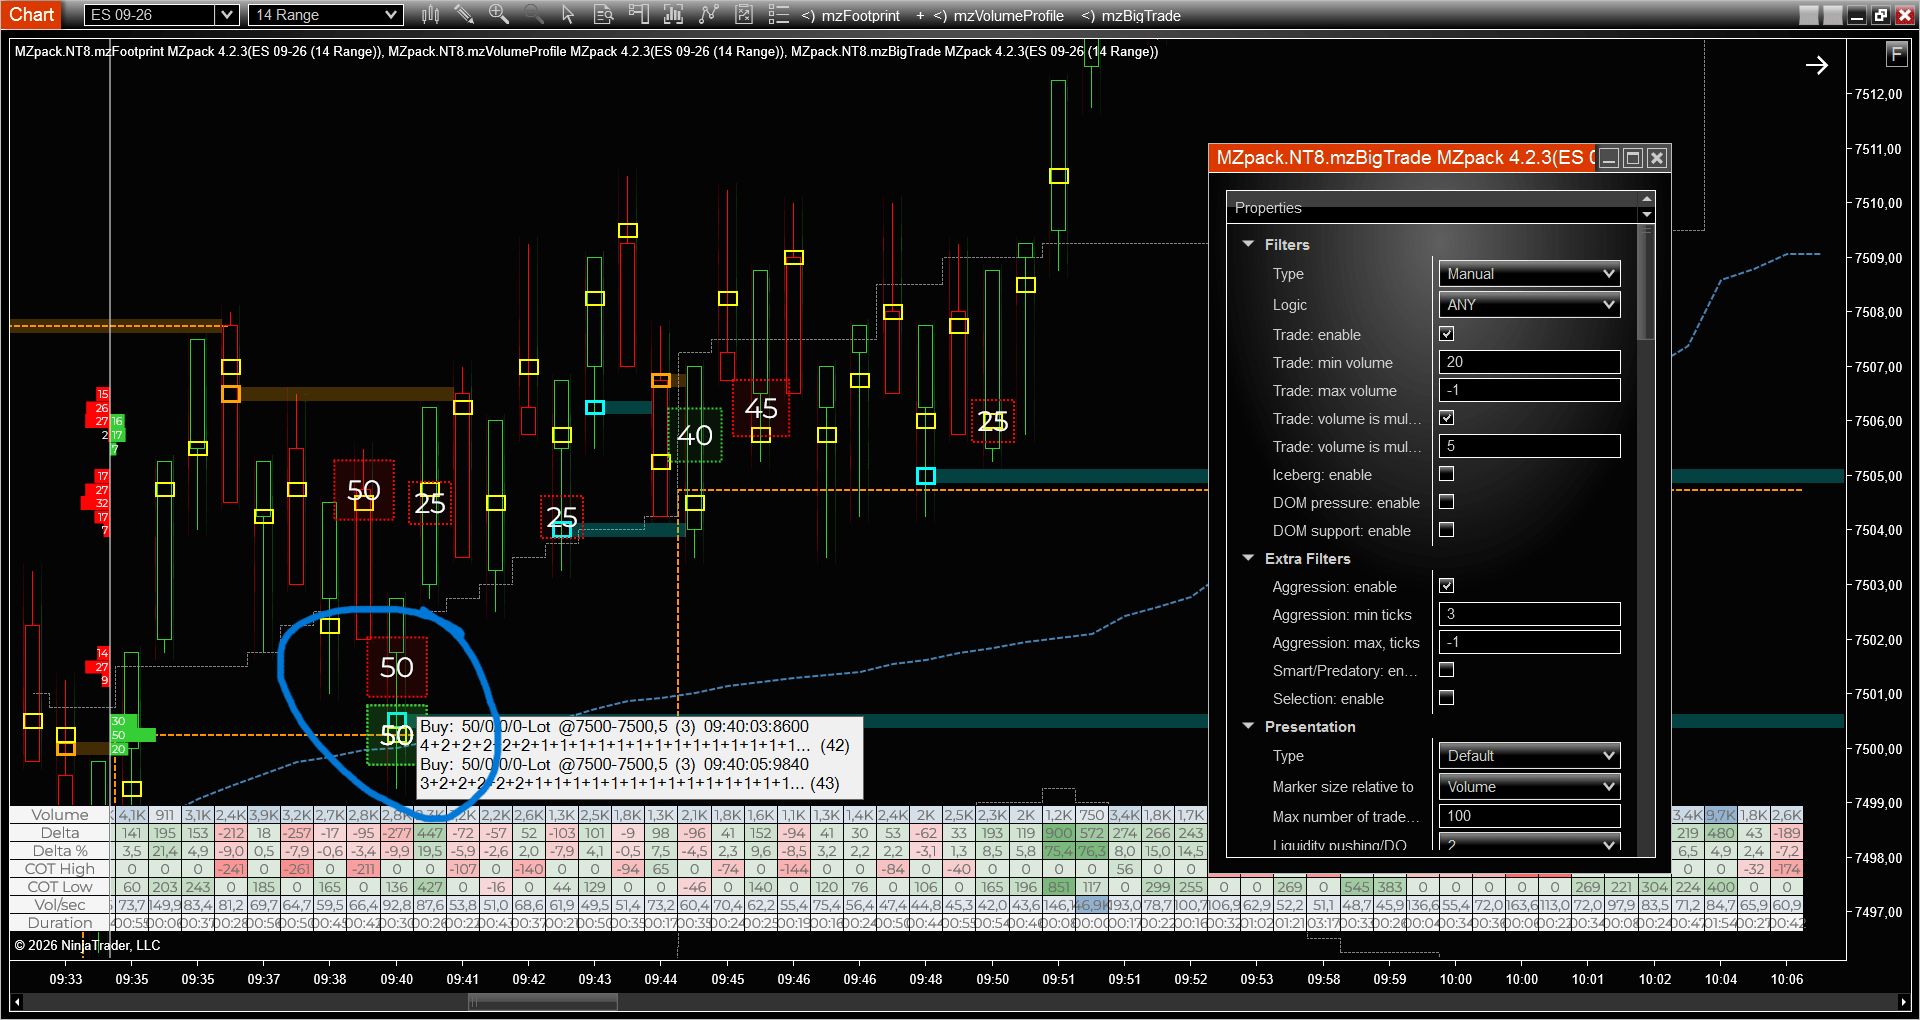
The same moment through Preset A (min volume 20, multiple of 5, aggression). The round-lot texture around the level – 25s, 40s, 45s, 50s. Deliberate size, not noise.
The outcome closes the arc. Price runs about 30 points off the defended POC, and on the breakout the same side turns initiative again: buys of 647 and 503 lots print at 7509.25-7511, the 503 a single market order sweeping eight price levels in 176 fills. Five of those fills are a uniform 57 lots each, all at the same price of 7510.5 – worth a second look below.

Outcome. About 30 points off the defended POC. On the breakout, a 503-lot buy sweeps eight levels at 7509.25-7511 in one order (a 647-lot print in the same cluster); inside it, five uniform 57-lot fills at 7510.5, eaten without a pause.
Now switch tape reconstruction off, and the same moment tells the other side’s story. The raw prints show five separate 57-lot buys at 7510.5 with the same timestamp: identical clips consumed one after another at a single price. That is the classic iceberg signature – a hidden sell order defending 7510.5 with a 57-lot visible clip, refilled five times inside one sweep, and eaten whole. That is the fingerprint of strength: not that someone bought 503 lots, but that they bought straight through a refilling iceberg without slowing down. Defense at the level, initiative on the break: two faces of the same size. (Iceberg detection was off here; the signature is read straight off the raw prints. Automated detection of exactly this read, historical data included, is planned for the next version of mzBigTrade – today it is a manual read.)
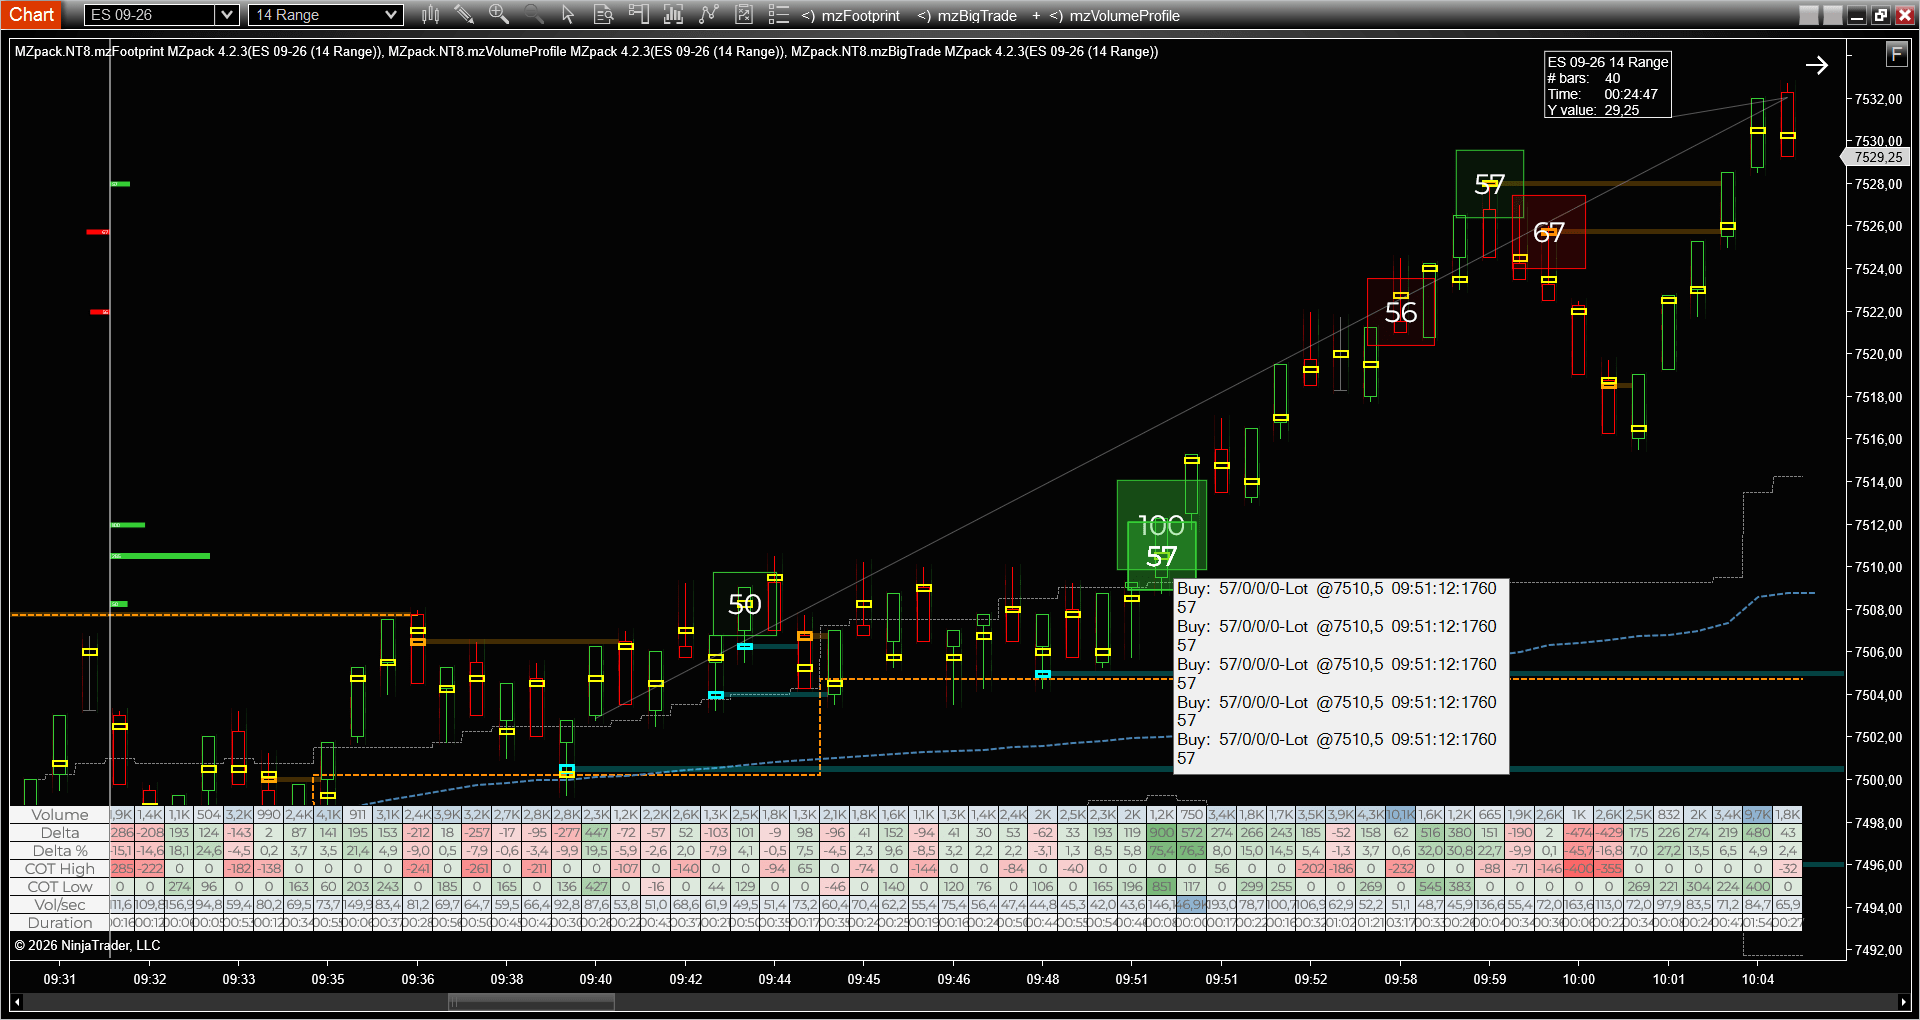
The same sweep with tape reconstruction off: five separate 57-lot prints at 7510.5, one timestamp. Identical clips refilling at one price – the iceberg signature, consumed without a pause.
Iceberg defense: the full anatomy of a hold (Market Replay)
A bounce at the overnight POC at 6716, read with the Iceberg filter (Hard, min 20) and DOM pressure (min 20) on, and the plain volume filter off – so only iceberg-fed and book-moving prints show. The defense printed in front of the level, a few points above it, so the POC itself never even got tagged. Three pop-ups tell the whole story in the total / iceberg / DOM pressure / DOM support format.
The attack: at 10:11:11 a sell of 95 lots sweeps three levels at 6722.5-6722, the kind of push that triggers resting stops. Its own pop-up dismantles it: 95/34/32/0. Of the 95 lots, 34 were matched against refilling iceberg volume – a hidden buyer – and 32 lots of fresh bids were added underneath right after it executed. The attack is being eaten and the defense reinforced inside the same second.

The attack dismantled. Sell 95/34/32/0 at 6722.5-6722: 34 lots eaten by a refilling iceberg, 32 lots of fresh bids added underneath right after execution.
The paper side: at 10:12:46 a buy of just 6 lots prints at 6719.25 with DOM pressure -25. As buyers pressed, 25 lots of displayed offers were pulled from the book, and all six fills are 1-lot resting orders. The displayed resistance would not trade: size that vanishes when tested is consistent with spoofing, and what actually traded was retail-sized.
The last flush: at 10:12:58 a sell of 27 lots at 6719 prints 27/26/1/0 – 26 of the 27 lots eaten by the iceberg. The hidden buyer took essentially the entire attack.
Then the familiar stack confirms: absorption fires at the level and the grid prints a rising run of positive COT Low. Real size on the buy side, paper on the sell side. The level holds and price rallies off the overnight POC – the run is visible to the right of both frames.

The paper side. Buy 6/0/-25/0 at 6719.25: 25 lots of displayed offers pulled as buyers press, only 1-lot orders trade. Then Sell 27/26/1/0 at 6719: the iceberg eats 26 of 27.
The break: defense without follow-through
The counterexample. Price approaches a POC at 6733 from below, and hidden sellers are visibly there: at 09:51:30, one tick under the level, a buy of 48 lots prints 48/47/2/0 and a buy of 32 lots prints 32/31/2/0 – both eaten almost entirely by refilling sell icebergs (47 of 48 and 31 of 32 lots). By the look of it, a defense.
But compare it with the holds. The scale is modest: 48 and 32 lots, nothing in the 95-lot or 500-lot class. The book does not reinforce: DOM pressure is 2 lots, against 32 fresh bids and 25 pulled offers in the previous case. And the second act never comes: the prints at the level never flip polarity – the defending side never turns initiative, no run of aggressive sells follows the absorption. Eating without escalation.
So the buyers just keep coming, the refills get consumed, and the POC breaks: price goes through 6733 and rallies away, visible to the right of the frame.
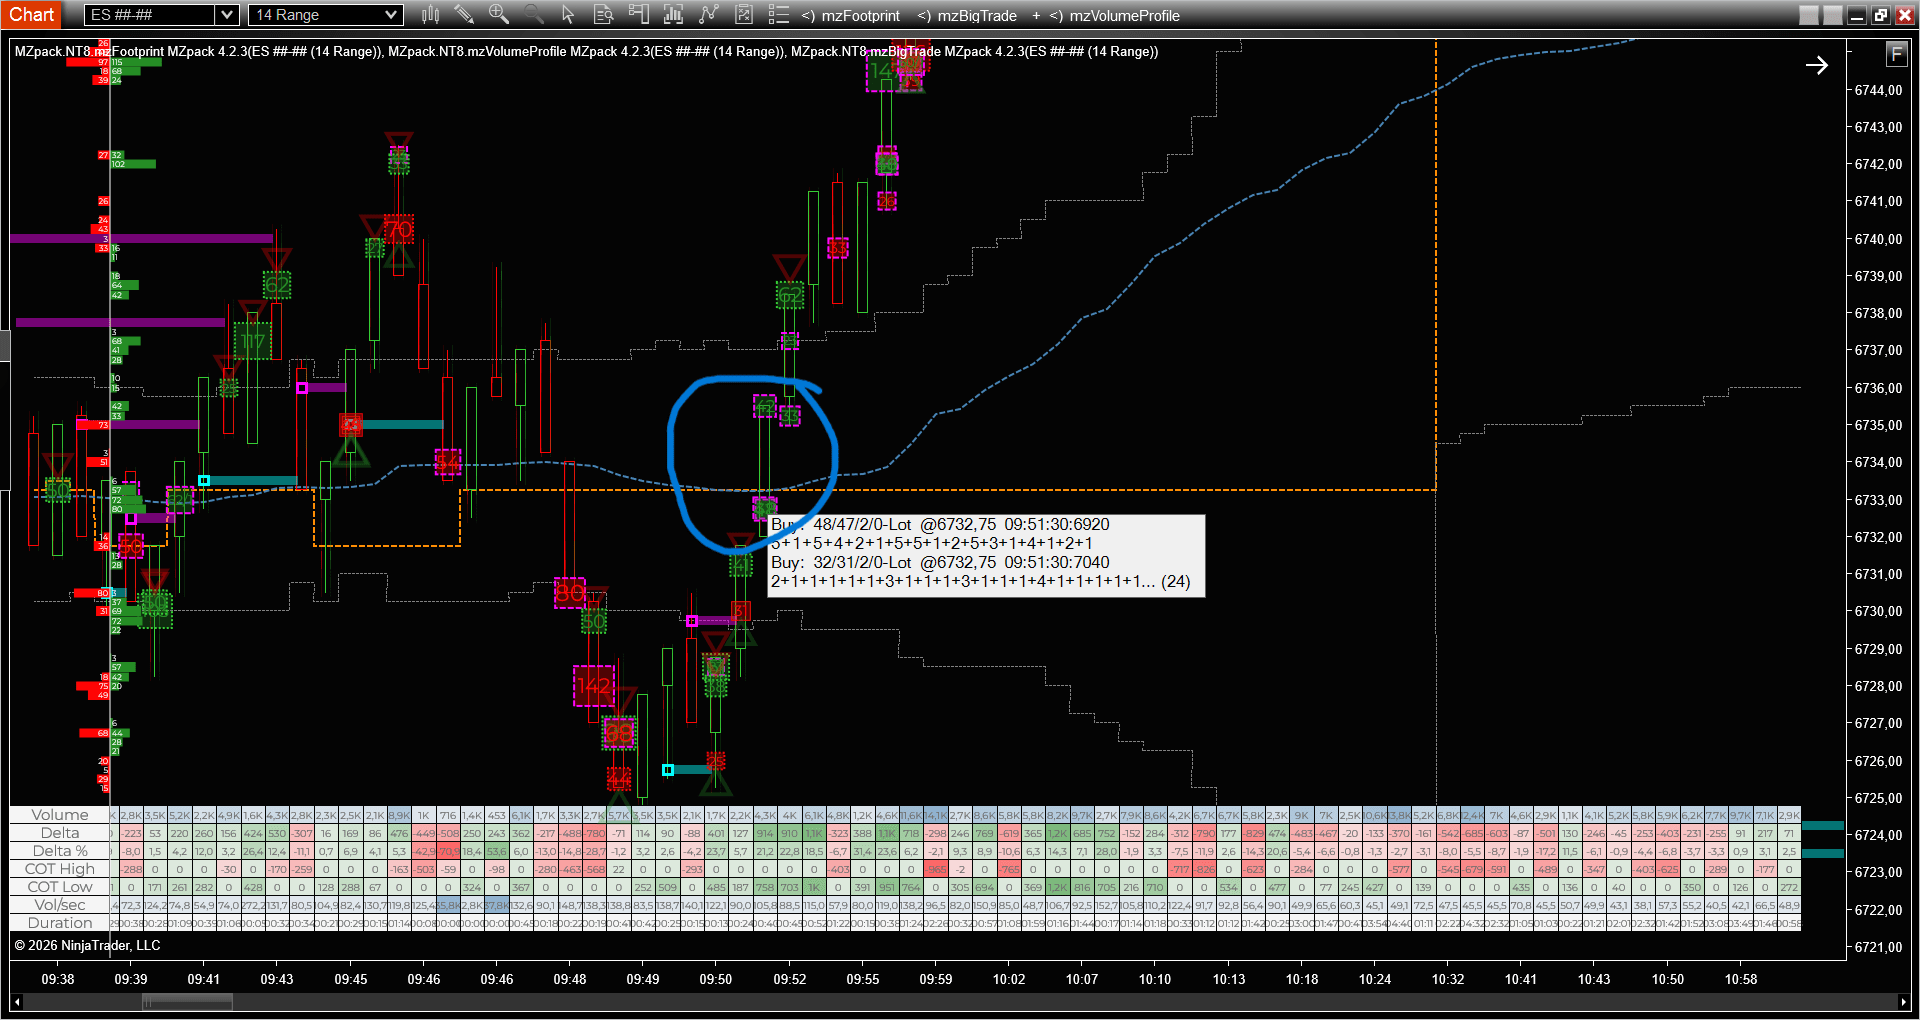
The break. Buys of 48 and 32 lots eaten almost entirely by sell icebergs (47/48, 31/32) one tick under the 6733 POC – but the defense never turns initiative, the book does not reinforce, and price breaks through and rallies away.
The lesson closes the series’ logic. Icebergs at a level are not a hold by themselves – hidden volume is the first act of a defense, not the proof of one. A hold is proven by what follows: the initiative act (the first case) or the layered defense of hidden size and the book together (the iceberg-defense case). Absorption that never escalates is a defense being overrun.
Entry
Nothing changes from the series method. The trigger is still the absorption-first hierarchy from Mirror Levels and POC Retest: context, level, absorption, then the grid. Defense is a conviction layer on top – it scales how much you trust the hold and the size you trade it with, it does not replace the trigger. A level with big prints and absorption is an A-setup; absorption with no size behind it is still a trade, just a lighter one; size with no absorption is no trade at all.
Aggressive and conservative entries carry over unchanged: aggressive on the close of the holding bar with the stop just beyond the level, conservative after one to three confirming bars.
Settings
mzBigTrade over the same 14 Range ES chart as the earlier setups. The concern with Default presentation is chart clutter on top of an already dense footprint, and the indicator has a dedicated answer: auto-filtering.
Two filter presets, both verified readable over a dense footprint on 14 Range ES, each answering a different question. The first case shows the same moment through both, and the case screenshots keep the settings panel open on purpose – the exact configuration is right there in the frame.
- Preset A, intentional size: Filters Type = Manual, Trade: min volume = 20, Volume is multiple of = 5, Aggression: min ticks = 3. Smaller prints make the cut only when they look deliberate – round sizes sweeping several ticks.
- Preset B, heavy hands only: Filters Type = Manual, Trade: min volume = 50, extra filters off, Trade marker = Box. Nothing but the big prints.
- Common to both: Presentation Type = Default, Marker size relative to = Volume, Max number of trades in chart frame = 100. This parameter has priority over all filters and caps the on-chart intensity; 100 stayed readable in testing, and zooming in reveals smaller trades adaptively.
- Trades Volume Profile: Show = on. For the iceberg map: Marker size relative to = Iceberg, with Iceberg enabled in Filters (live / Market Replay only).
- If the chart still feels busy: Marker = Line with Position = POC is the least intrusive combination – one mark per trade at its point of control.
These are starting points, not gospel. The right min volume and frame cap depend on the instrument and on how dense your footprint already is: raise them and more size becomes visible, lower them and only the heaviest hands remain.
The level comes from mzFootprint or mzVolumeProfile; the who comes from mzBigTrade. Three indicators, one chart, one method.
Template
Import this template and the chart comes set up as in the article – the mzBigTrade filters, the footprint, and the profile – so you do not have to configure it by hand.
Download the template