A volume Point of Control, the POC, is the price where the most volume traded inside a profile – the market’s accepted fair price for that period. Price keeps getting drawn back to it. A POC that price has not returned to since it formed – a naked POC – is an especially strong magnet, because the unfinished business at that price is still there.
But a return to a POC is not a trade on its own. Price either bounces off it (the level holds) or trades straight through it (the level is done). On a bare chart those two look identical until it is over.
This is the same problem the Mirror Levels setup solves, and the same order-flow stack answers it. The only thing that changes is where the level comes from. Here the level is read in mzVolumeProfile (the POC), and the confirmation is read in mzFootprint (absorption, COT, delta) at that price. Two indicators, one chart, working together.
How a POC retest forms
Three parts, in order.
First, the level. A prior profile leaves a POC. In mzVolumeProfile, set the POC mode to Naked so an untested POC stays drawn until price tags it – that is your level, and the naked ones are the cleanest. The POC can be from any profile the market gives you – overnight, RTH, or a prior session – and the setup reads the same on each. Treat the POC as a zone, not an exact tick. Absorption rarely lands exactly on the POC print, so define a band of a few ticks around it and count order flow anywhere inside that band. Levels are zones, not lines; the width is your call.
Second, the return. Price moves away from the POC and later comes back to it.
Third, the decision at the touch. Does the POC hold or break? That is read on the footprint, not on the candles.

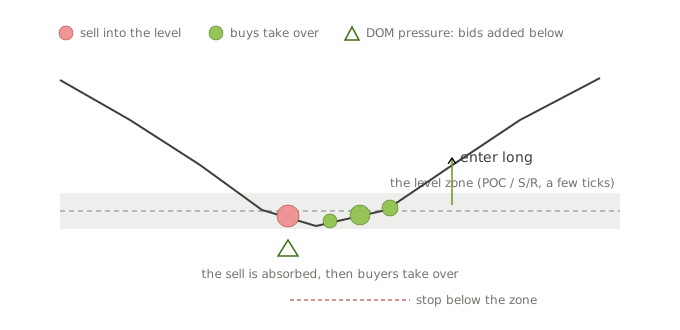
A long is price returning down to a POC that then holds as support; a short is price returning up to a POC that holds as resistance. A first touch of a naked POC is the cleanest version. Entry is on the close of the bar that holds the POC; the stop is short by design, just beyond the POC (below it for a long). Invert every sign for a short.
But returning to a POC and holding it are different things, and this is where the retest either pays or traps you. The validation is next.
Validating the retest: absorption first, then the grid
This is the same hierarchy as the Mirror Levels article, so if you have read that, you already know it. Only the level source changed – a POC instead of an imbalance zone. Three layers, in order of priority.
1. Absorption – the primary filter
Absorption is what separates a hold from a break, so it comes first. In mzFootprint, absorption is a diagonal imbalance with level rejection: aggressive market orders hit the POC, limit orders eat them, and price bounces instead of pushing through.
If the absorption flag fires at or within the POC zone, the level was defended and you have a bounce candidate. If it does not fire, price ran through the POC – the level got tagged and is done, that is a break, not a retest to trade. Everything below is secondary to this.
2. The COT Flip – direction and holding
When there is delta to read, the grid confirms which way the POC is being defended and whether the defence holds. COT High is the cumulative delta from the moment a bar prints its high; COT Low, from the moment it prints its low.
For a long support retest you want the commitment extreme on the low: COT Low turns positive and stays positive across more than one bar, while COT High collapses toward zero. Delta picks a side and holds it across consecutive bars, and Delta % expands well past the single-digit chop. For a short resistance retest, invert every sign.
Two cautions carry over from the method. The defence holding for more than one bar is confirmation, not a precondition – at the close of the holding bar the next bar does not exist yet, so it is either the signal for a conservative entry or the way a failed retest is recognized after the fact. And delta can be silent: a bar can post zero delta and flat COT and still be a valid hold if absorption fired and the bar sits on the POC.
3. Conviction – POC prominence and zone volume
Two things scale how much to trust the level. First, how dominant the POC is in its profile: a clear single high-volume peak is a stronger level than a flat or double-distribution profile where no price really won. Second, the footprint volume defending the retest, exactly the zone-volume gradient from the Mirror Levels method. Use both as a gradient, not a gate.
Context gate
A retest is cleaner when price returns to the POC from outside the value area after a directional move, rather than chopping back and forth across the same prices inside value. The move that took price away from the POC is the repositioning that makes the return meaningful.
What the cases look like
Three real ES 14 range examples: a valid hold confirmed by a COT Flip, a reclaim, and a two-in-one on two different POCs that shows both a short and a long.
Valid hold, COT Flip confirmed
A real ES 14 range example at a POC near 6658.25 (the orange line). Read the sequence in the grid, left to right.
Into the level, sellers push price down: the approach bars print negative COT High (around -435, -350, -189, -110) with elevated Vol/sec (307, 333). Highs are rejected and price is driven down to the POC – support approached from above, in numbers.
At the POC, absorption fires: the cyan box on the orange line is a sell absorption, limit buyers eating the aggressive selling with a bounce. The primary filter is satisfied, so this is a hold, not a break.
Coming out, COT migrates to the low: a run of positive COT Low (44, 119, 197, 356, 218) with expanding positive Delta % (25.2, 13.3), and price lifts off the POC. The support flip confirms the hold.
Approach with negative COT High, absorption on the POC, then a COT Flip to the low. The textbook valid hold.
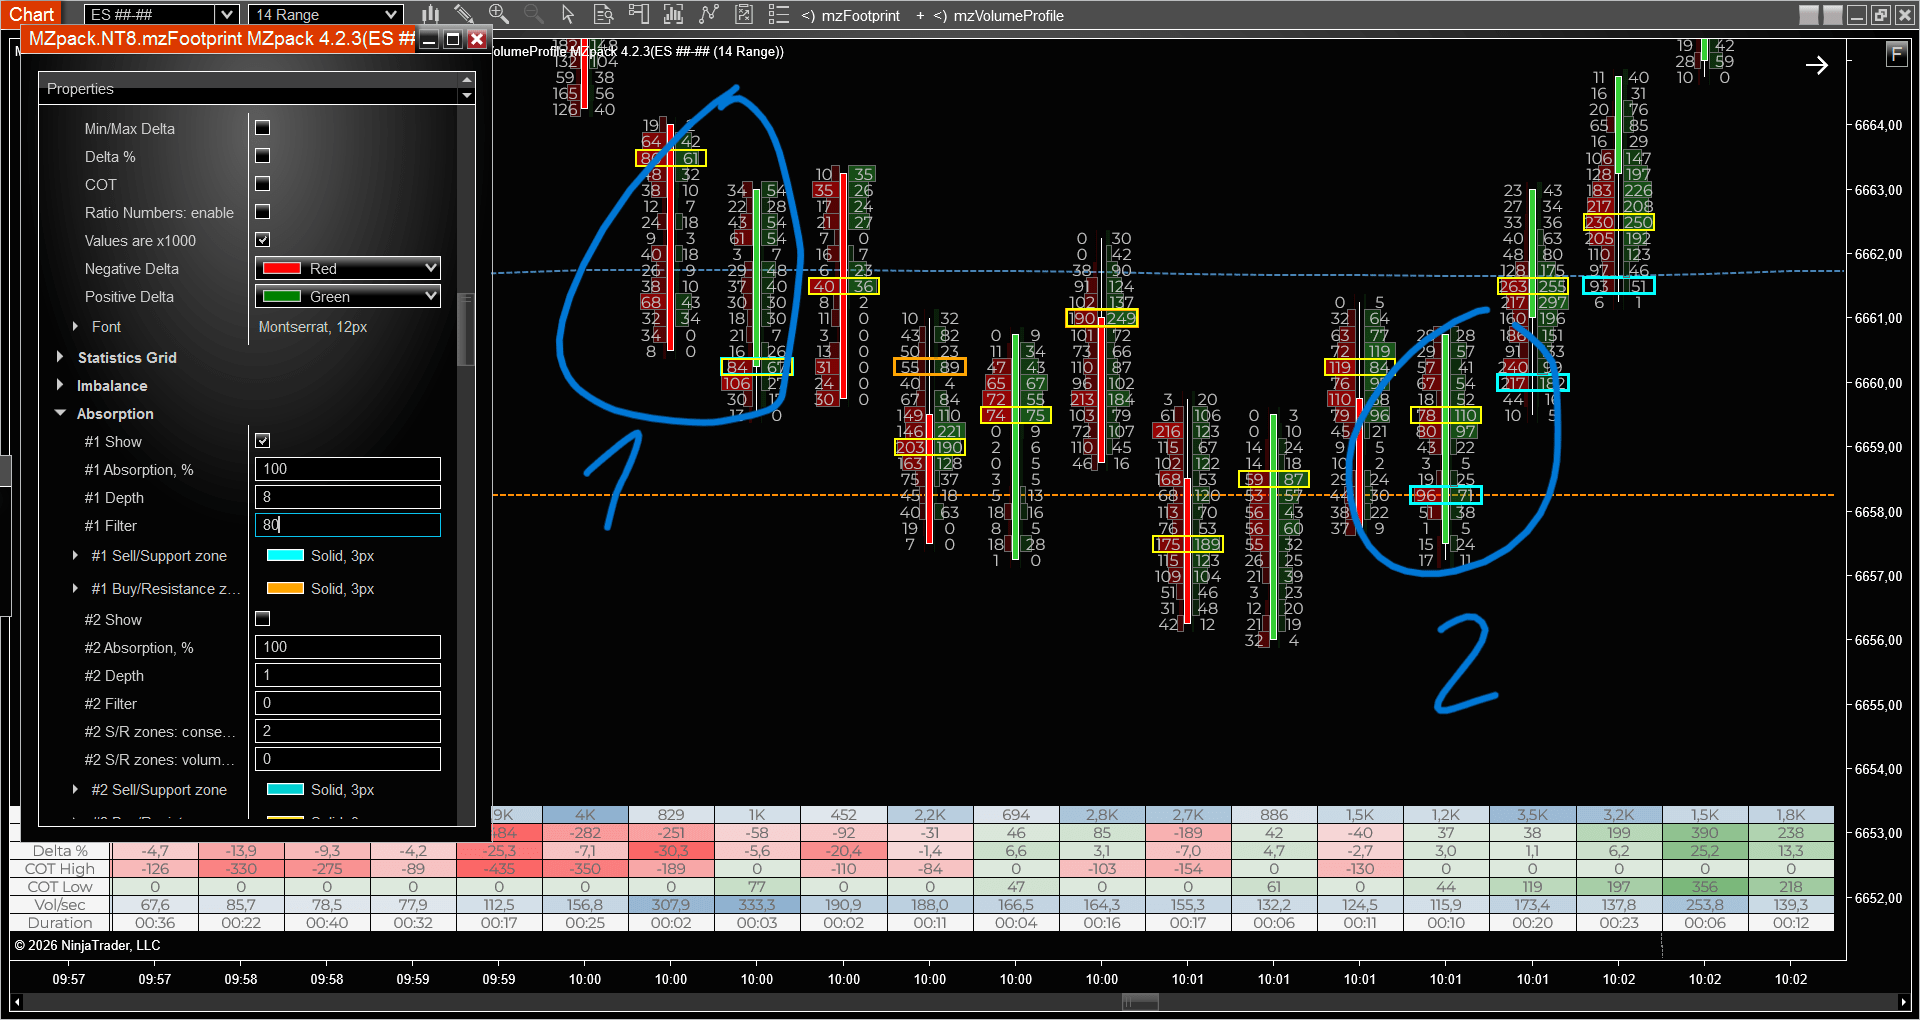
Valid hold at a POC. Sellers drive price into the level (negative COT High), sell absorption fires on the POC (cyan), then COT flips to the low (positive COT Low, expanding Delta %) and price bounces.
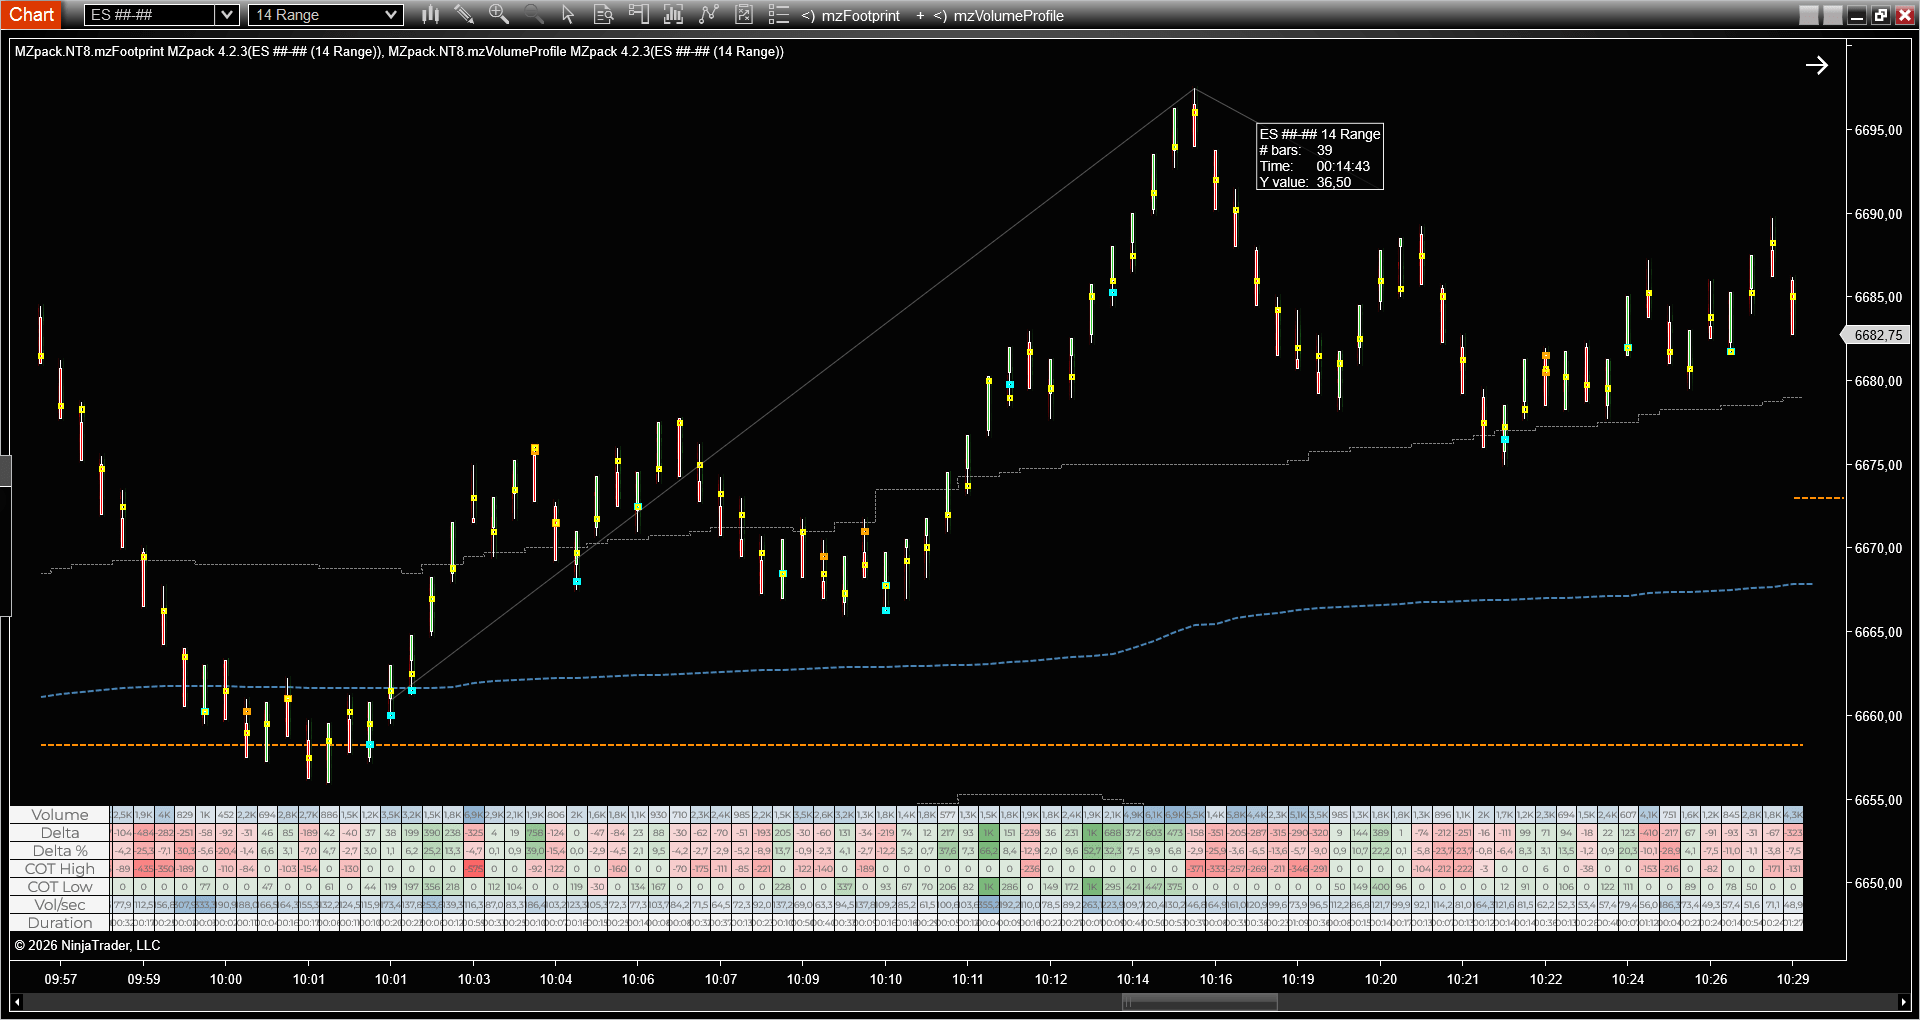
Outcome. The POC held and price lifted off it.
Valid hold, reclaim (failed breakdown)
The hold does not always come from price stopping at the POC. Sometimes price breaks below the POC into an absorption zone underneath, the absorption floor holds, and a reclaim bar closes back above the POC. On the ES 14 range example around the 7551.75 POC, sellers pushed price through the POC into a sell absorption below it, printed a strongly negative COT High (around -696) but did not extend below the absorption, and the next bar, on high volume, closed back above the POC.
A reclaim bar is a bar that trades through a level and closes back on the original side of it: price dips below the POC, but the bar closes above it. It is the order-flow version of a failed breakdown, also called a bear trap. The term reclaim (reclaiming a level) is standard trading vocabulary.
Be honest about what confirms this one. The reclaim bar here carries no absorption of its own – the confirmation is the close location, the bar closing back above the POC, resting on the absorption floor that held below. This is the one place the setup leans partly on price rather than pure order flow, so the held absorption floor beneath the POC is what keeps it grounded: no floor, no reclaim to trust. Entry is aggressive on the reclaim bar close with the stop behind its low, or conservative from the POC on a pullback with the stop behind the absorption below.

Reclaim. Price breaks below the POC into a sell absorption, the floor holds (strong negative COT High, no extension below), then a high-volume reclaim bar closes back above the POC. Confirmation is the close location on top of the held floor.
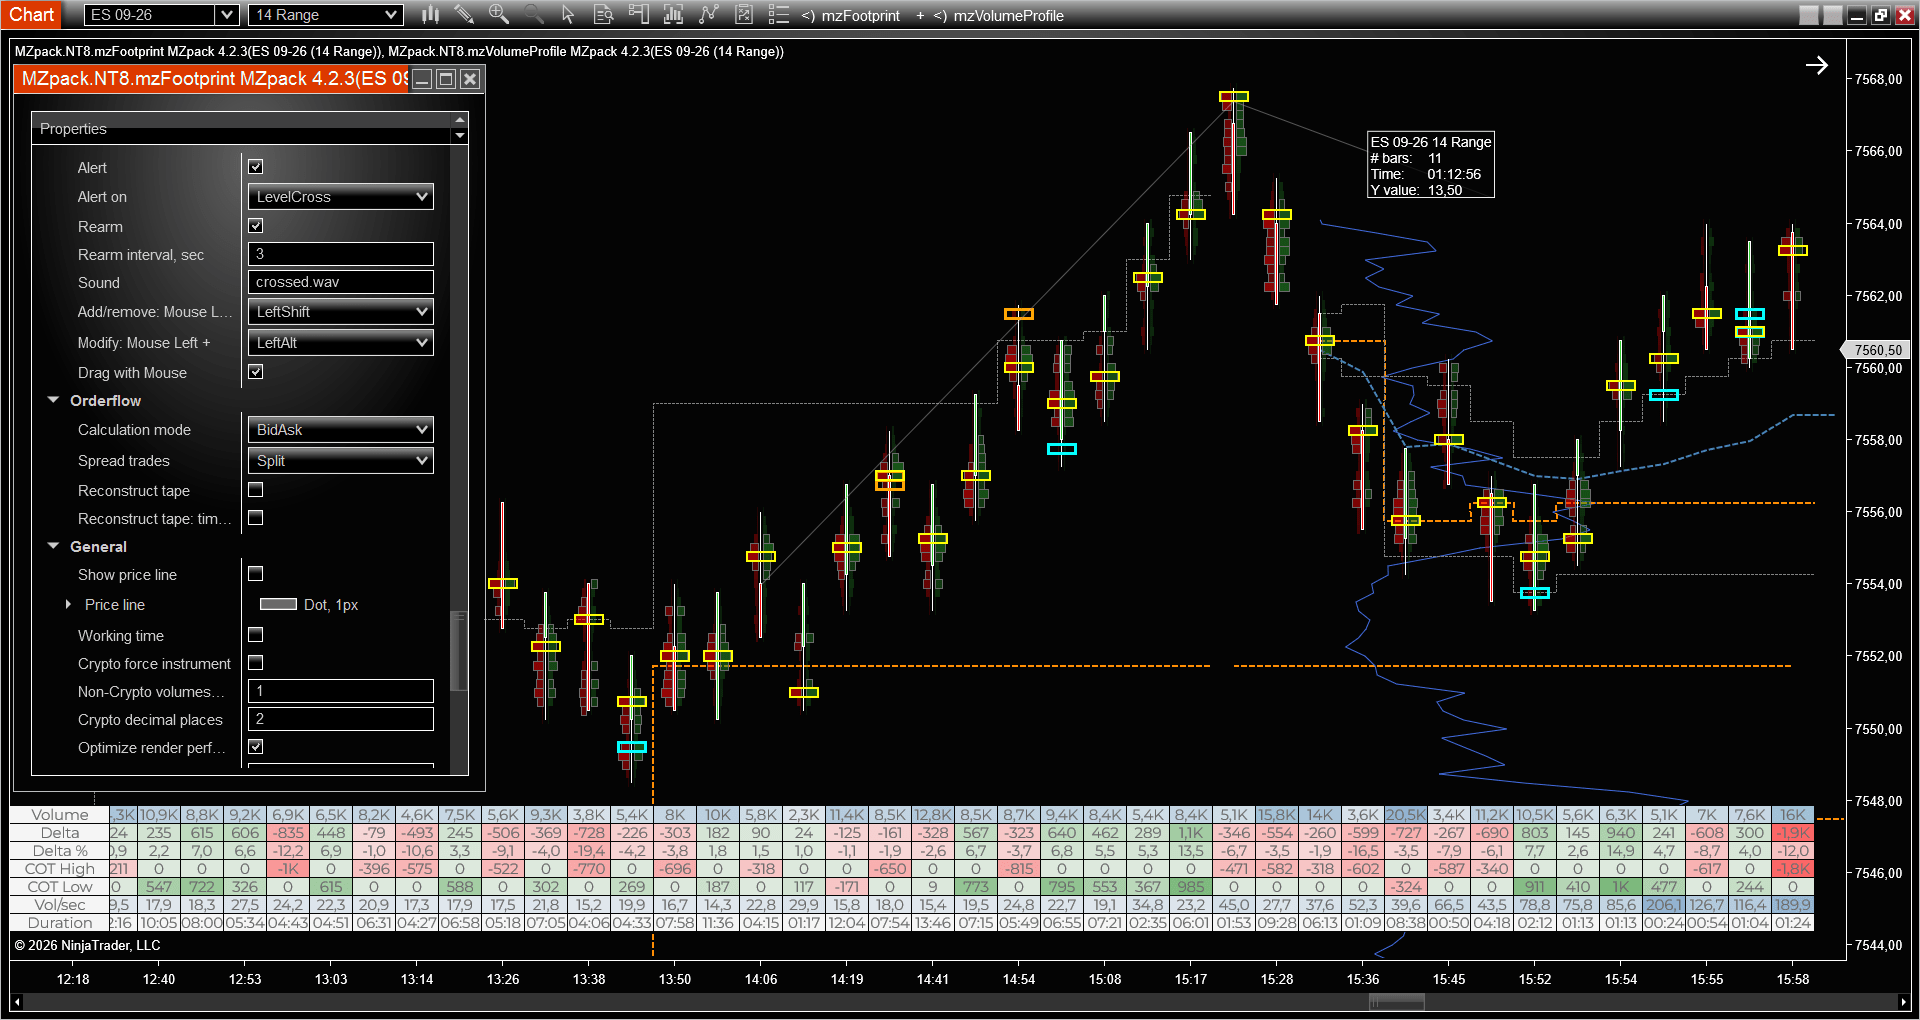
Outcome. Price reclaimed the POC and continued up.
Both directions: a short at the overnight POC, a long at the RTH POC
One ES 14 range window, two POCs, two trades in opposite directions, and the first short in this article. It also shows the setup on more than one profile: an overnight POC and an RTH POC in the same picture.
At 9:36, a short at the overnight POC (the brown line near 7508). Price tests the overnight POC as resistance and rejects down: the bar prints negative COT High (around -241) with negative delta (-212), the high rejected and sellers on top. A buy absorption fires at the level (the orange box, buy/resistance in these settings), aggressive buying into the level eaten, and price turns down. Short on the bar close, stop above the high. The setup inverted, an overnight POC acting as resistance.
At 9:40, a long at the RTH POC (the orange dashed line near 7500.25). Price flips to the long side at the RTH POC as support: a strong bar of +447 delta (+19.5%) with a large positive COT Low (427), buyers holding the low and COT flipping to the low. A sell absorption fires (the cyan box, sell/support), and price lifts. Long on the bar close, stop below the low.
Same method both times, only the POC and the direction change. Orange absorption at a POC is resistance and a short; cyan absorption at a POC is support and a long.

Two in one. 9:36 short at the overnight POC (orange buy absorption, negative COT High); 9:40 long at the RTH POC (cyan sell absorption, positive COT Low).
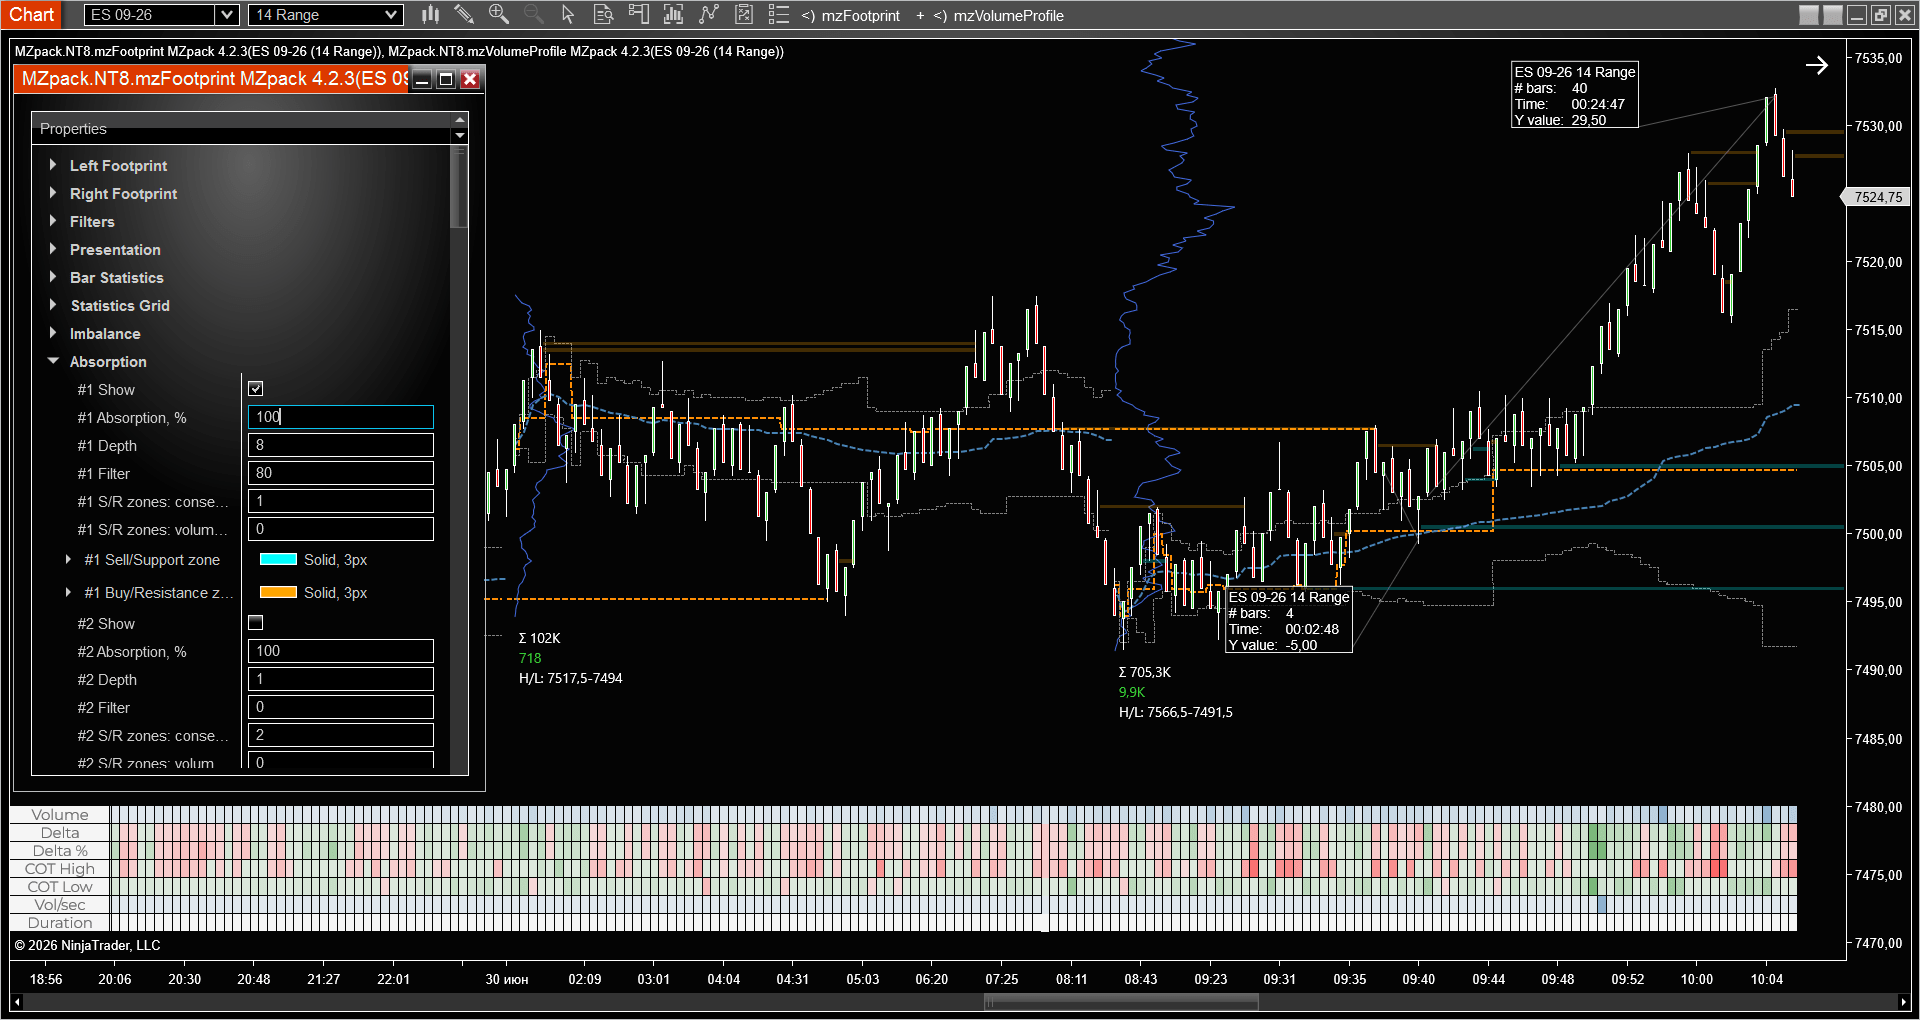
Outcome. Price fell from the overnight-POC short down into the RTH POC, then reversed up on the RTH-POC long.
Entry, aggressive and conservative
Aggressive: on the close of the bar that holds the POC, with absorption fired and a positive COT Low on that bar. The stop is short – just below the POC. You do not know the next bar, and the short stop is what caps a one-bar fake.
Conservative: wait the next one to three bars for confirmation (your call). COT Low stays positive, COT High does not drop negative, and you enter on the close of the confirming bar. Fewer trades and a worse price, but the one-bar fakes drop out.
On range bars this matters more than it sounds. A range bar prints on movement, not on time, so on a sharp bounce off the POC one to three range bars can pass in seconds and the event resolves bar by bar as it happens. That is why this setup is shown on a 14 range chart rather than a time chart: on a minute chart the same bounce can collapse into a single bar and the confirmation only arrives after the move is gone, while on range bars absorption and the COT Flip are readable in real time. Waiting a couple of range bars is not the same as waiting minutes.
Settings
In mzVolumeProfile (the level):
- Profile mode: RTH_ETH or Session, or Daily for Forex
- POC mode: Naked, so untested POCs stand out (Extended also works to carry the line to current price)
- VA, %: 70 to see the value area around the POC
- Profile Statistics: POC on
In mzFootprint, on the same chart (the confirmation):
- Absorption: enabled – it is the primary filter, so it has to be visible. A noise-filtered tune for 14 range ES: Absorption % = 100 (imbalance side at least 2:1), Depth = 8 levels (8 ticks, 2 pts ES at Ticks per level = 1, so the flag needs a real bounce off the level), Filter = 80 (minimum contracts on the absorbing side).
- Ticks per level: 1 – no aggregation, so each tick is its own cluster row and the event reads bar by bar on range bars.
- COT High, COT Low, Delta, Delta %, Volume, Volume per second: show
These absorption thresholds are a starting point, not gospel. Range bars carry far less volume than time bars, so a Filter that made sense on a minute chart (hundreds of contracts) would silence almost everything here – the 80 reflects that. Because absorption is the primary filter, calibrate Filter and Absorption % against confirmed valid holds rather than just raising them to kill noise: too strict and you hide valid setups, including a silent-delta hold that rests entirely on absorption. If a known good bar does not flag, lower Filter first, then Absorption %.
The level comes from mzVolumeProfile, the confirmation from mzFootprint. Running both on one chart is the whole point of the setup.
Template
Import this template and the grid columns and the absorption settings above come set up as in the article, so you do not have to configure them by hand.
Download chart template