Iceberg detection has always had one frustrating limitation: it needed live data. The classic approach — watching how liquidity at the best bid or ask behaves at the moment a trade executes — cannot run on a cold historical chart, because the order book is long gone. That’s how the Hard and Soft algorithms in mzBigTrade work, and why the User Guide has always noted “works on live or Market Replay data only.”
The Tape algorithm removes that limitation. It estimates hidden refilling-iceberg volume from the tape alone — the executed prints, no order book involved. Which means it works anywhere: live, Market Replay, and, for the first time, on plain historical data.
Why icebergs are worth finding at all
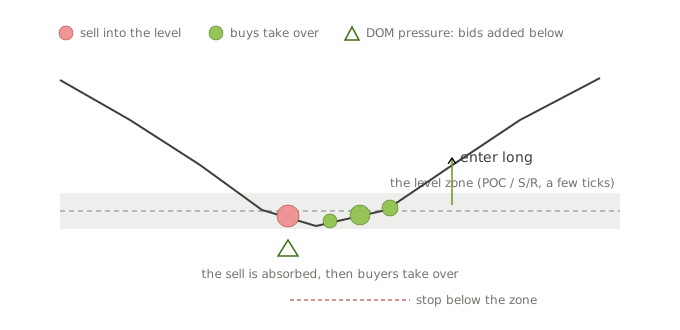
An iceberg is commitment made visible — barely. Someone with size to execute chose not to chase price with market orders but to sit at a level and absorb whatever comes, hiding their true intent from the book. That’s informed, patient positioning, and it marks a price the participant is willing to defend. When an aggressor runs into an iceberg, one of two things happens: the attack exhausts itself against the hidden reserve and price rejects the level — or the reserve gets eaten through and the defense fails, often releasing a sharp move. Either outcome is tradable; what’s costly is not knowing the battle happened. On historical charts, until now, you didn’t.
The footprint an iceberg leaves on the tape
A refilling iceberg shows only a small tip in the book. Each time an aggressor consumes that tip, the hidden reserve instantly replenishes it — same price, same size, again and again. The book activity is invisible in history, but the fills it produced are not. On the tape this leaves a distinctive signature: a run of identical-size fills at one price. We call it a clip.
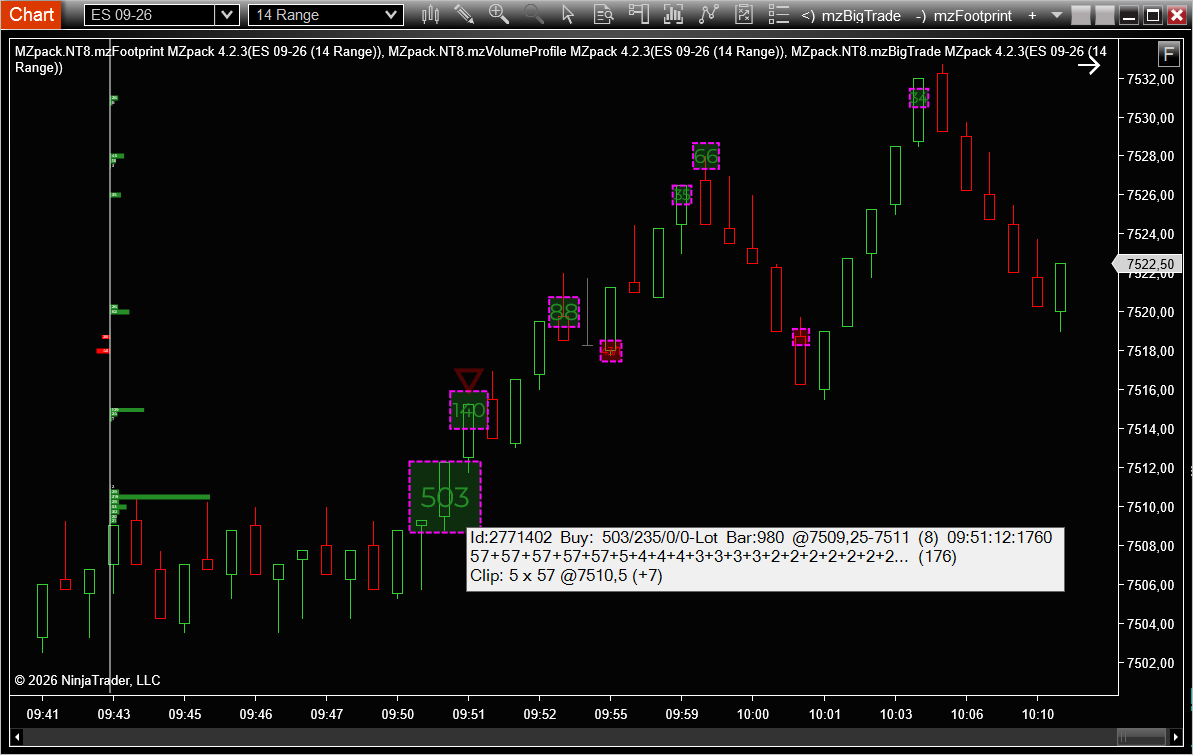
Look at the chart. The 503-lot buy at 09:51 swept eight price levels, 176 fills in total. Inside its composition sits a run of five consecutive fills of exactly 57 contracts at 7510,5. Five identical prints, one price, one timestamp. That is not retail orders coincidentally matching — that is a machine refilling its display quantity five times under pressure. Note what happened next on the chart: the buyer ate through the seller’s defense, and the market kept climbing for the following ten minutes. A defeated iceberg is information too.
How the estimate works
The first clip is the visible tip; every additional clip is a refill from hidden reserve. So hidden volume is (refills − 1) × clip size. For the trade on the chart: (5 − 1) × 57 = 228 contracts. A smaller same-price remainder after the run — a partially consumed final refill — is added on top: that’s the “(+7)” in the pop-up line Clip: 5 x 57 @7510,5 (+7).
Two parameters control sensitivity: Iceberg: tape min clip sets the minimum fill size that qualifies, filtering small-lot noise; Iceberg: tape min refills sets how many consecutive identical fills are required — the consecutiveness is what separates a genuine iceberg from coincidental same-size prints.
Reading detections in context
A few practical patterns. An iceberg that held — price attacked the level and rejected it — marks defended territory: expect the level to matter on a retest, especially if it goes untested (naked) for a while. An iceberg that was eaten, like the one on the chart, tells you the defender is done; the level often flips roles, and the side that won the fight tends to press its advantage. Clusters of detections at one price across the session are conviction — someone keeps reloading there. And the clip size itself is a fingerprint: machines often reuse the same display quantity all day (57 recurred through this session), so spotting the size elsewhere on the tape hints the same player is still active.
What Tape detection can and cannot see
It only sees uniform clips. Algorithms that randomize display quantity leave no clip pattern and pass undetected. Catching those requires watching the book replenish live — exactly what DOM-based detection does. The two approaches are complementary.
It needs the iceberg to be hit repeatedly within one trade. The signature forms inside a single reconstructed trade’s fill composition. An iceberg consumed slowly by many small independent trades won’t produce a run.
It’s a floor, not a measurement. The formula counts refills that printed; reserve left unexecuted when the aggressor stopped is invisible by definition. The iceberg was at least this big.
Coincidence is filtered, not eliminated. The clip/refills thresholds make accidental patterns rare, but on very active instruments they occasionally occur. Treat a single detection as evidence, a cluster at one level as conviction.
Fully integrated, nothing to relearn
Tape detection writes into the same iceberg volume as the DOM-based algorithms (without double counting when both run), so everything you already use simply lights up on historical data: the Iceberg: min volume filter, Marker size relative to = Iceberg, the iceberg map in Trades Volume Profile, and the pop-up info. Enable Iceberg: tape in the Filters group, load a historical chart, and the icebergs are there — including the ones that were eaten months ago.