Get 24/7 Free Support
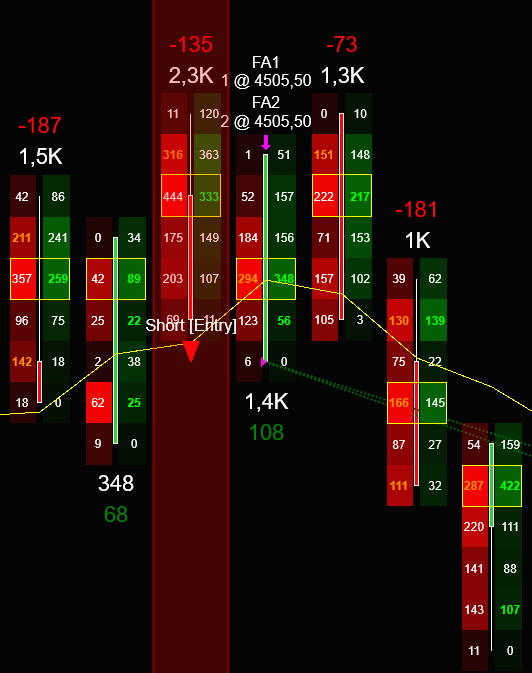
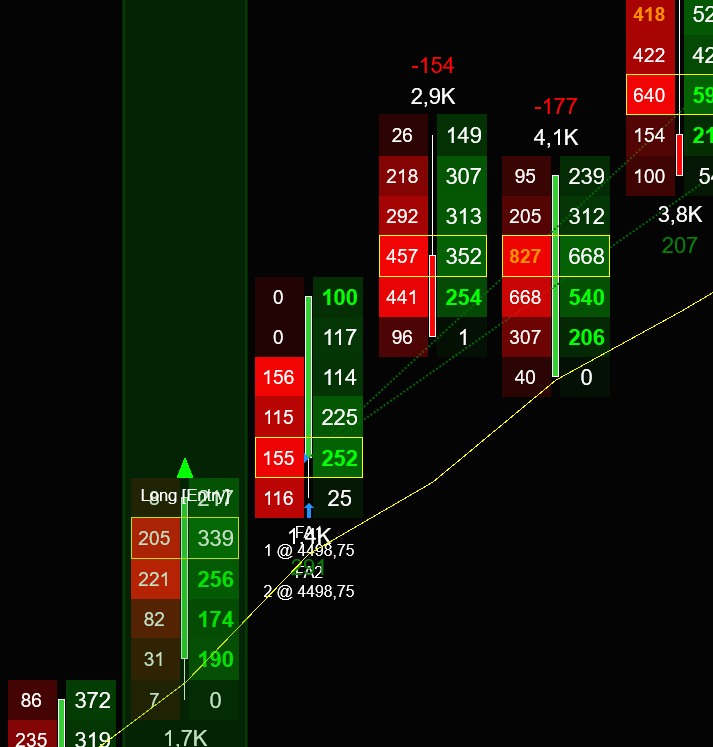
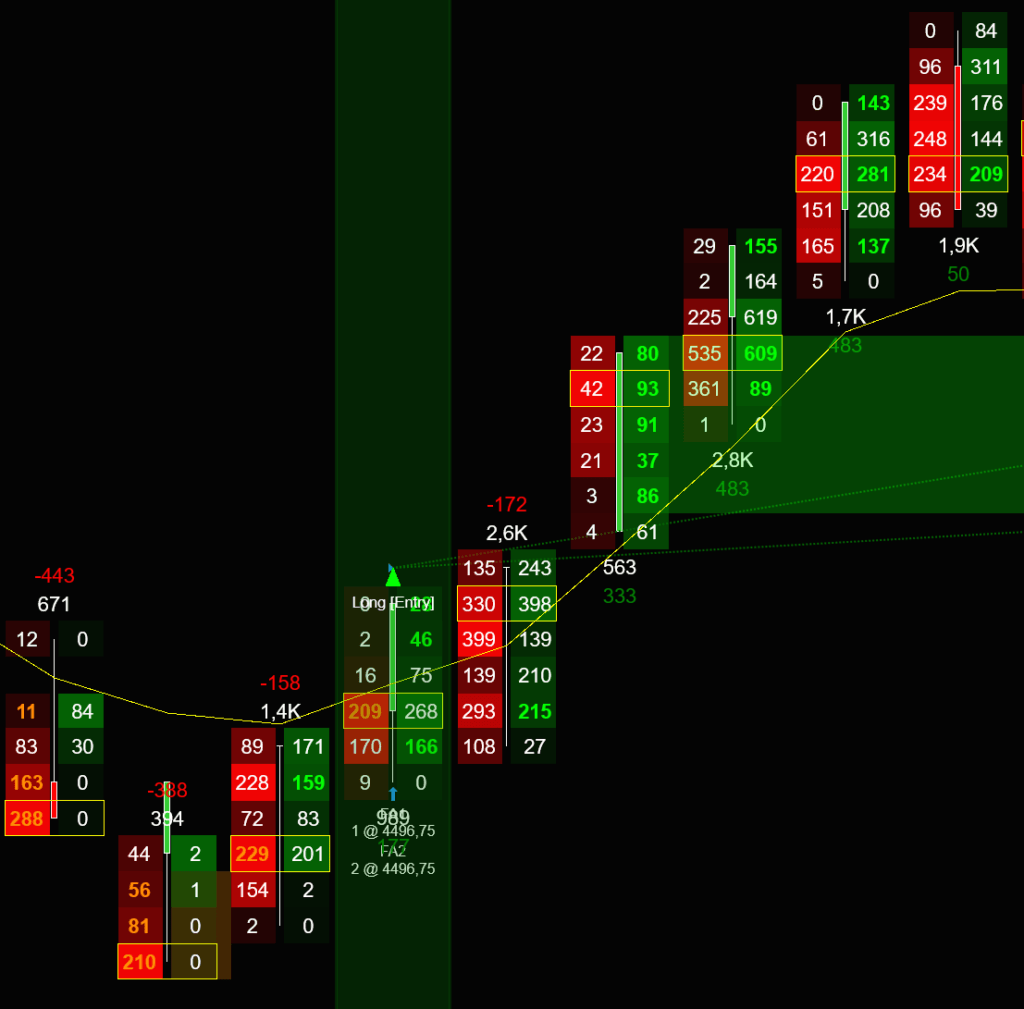
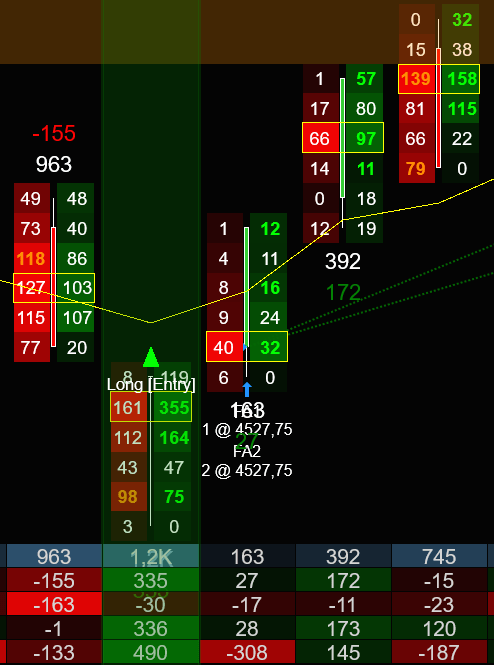
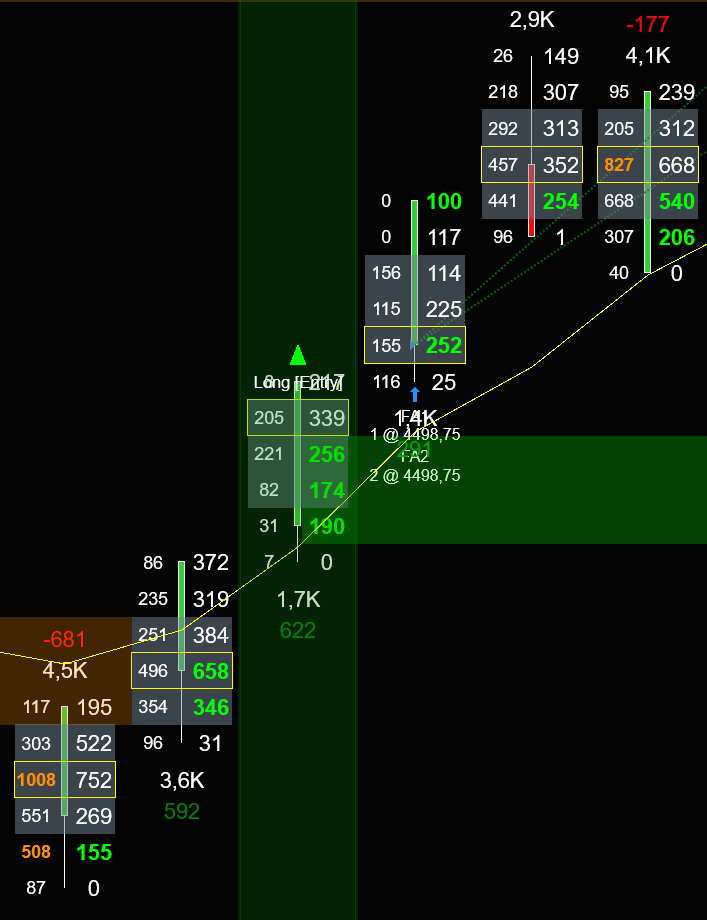
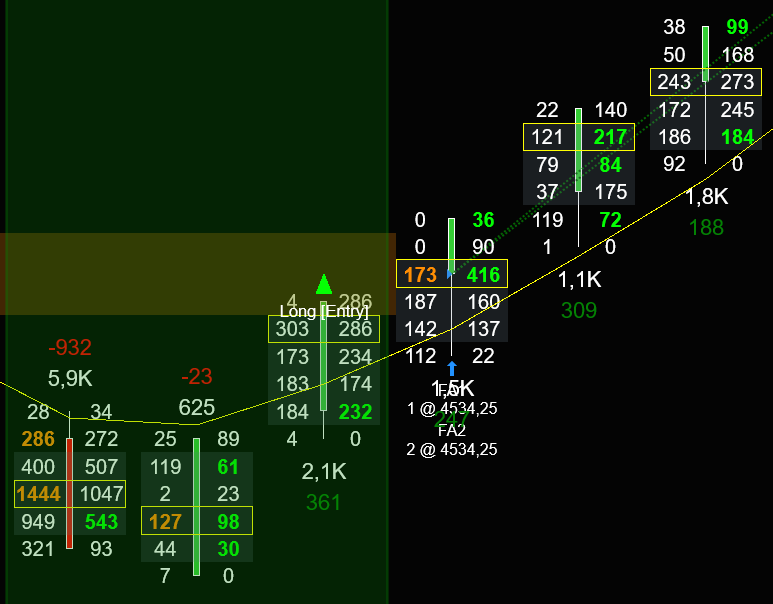
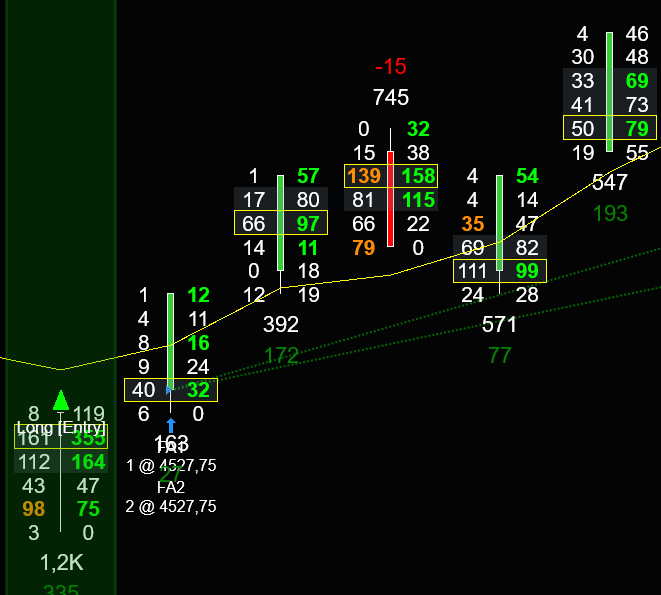
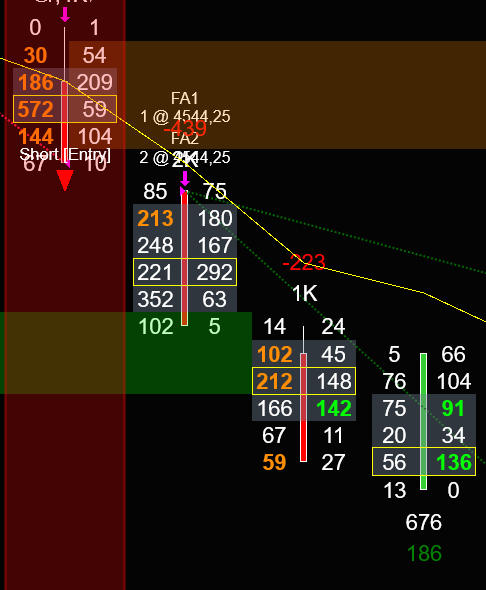
Footprint Action Order Flow Strategy for NinjaTrader
The Strategy
Features
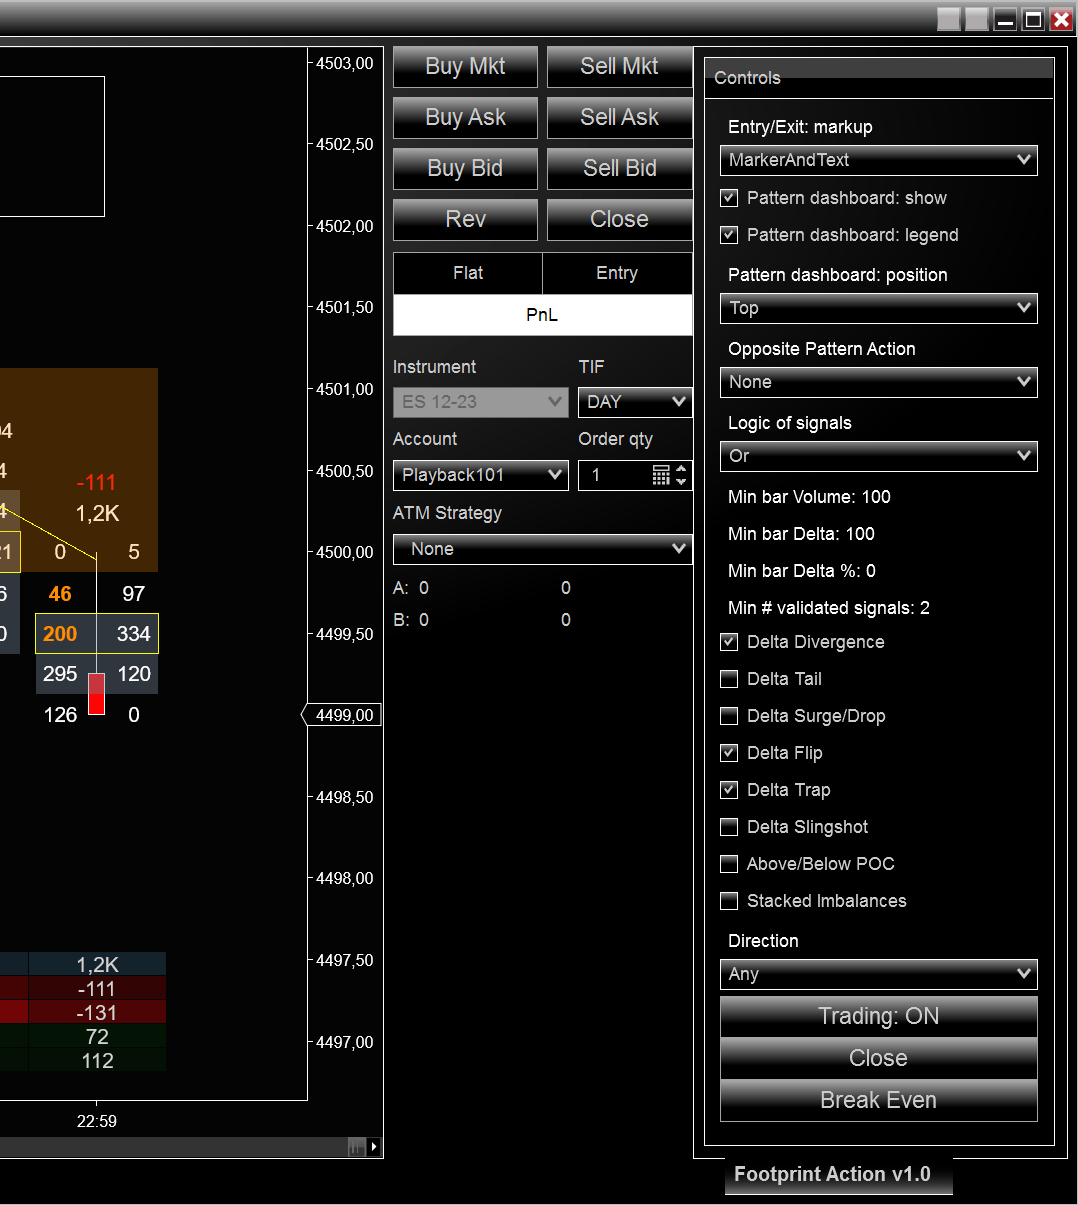
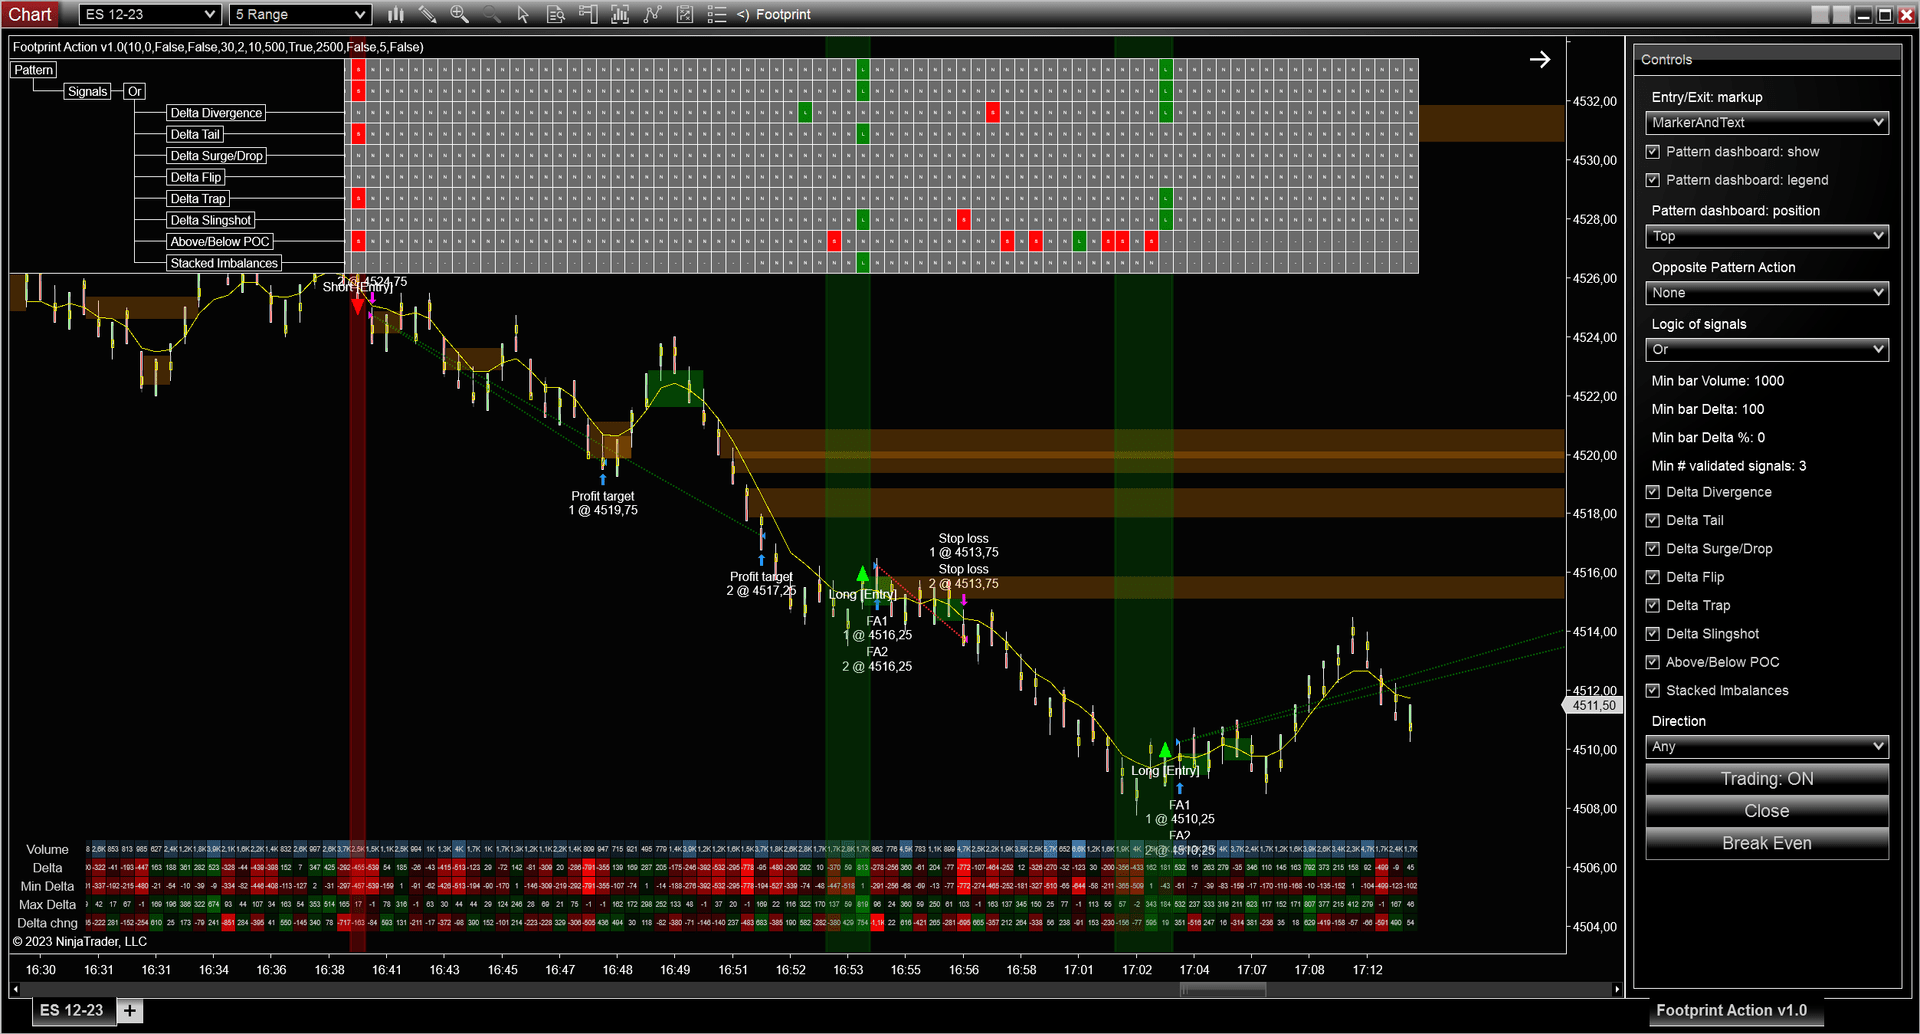
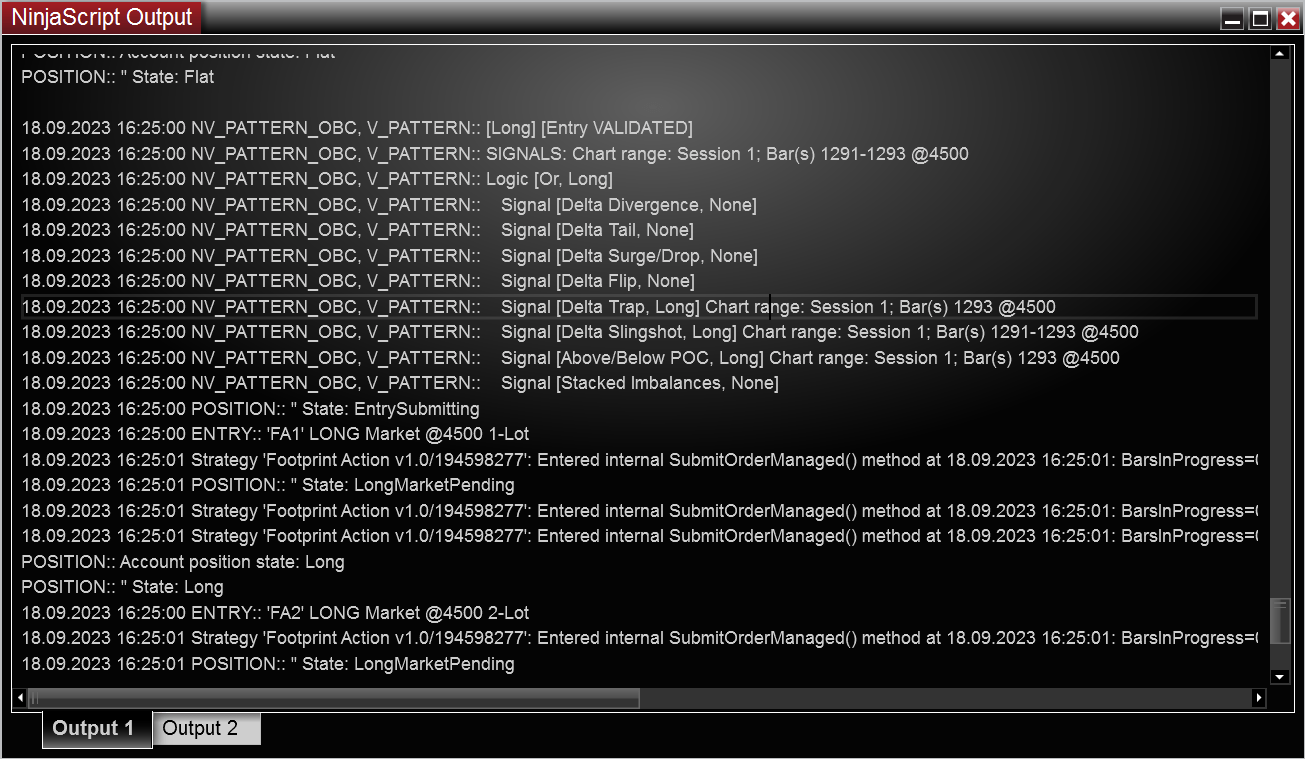
- Supports 9 orderflow signals. More signals will come soon
- Auto trade and Manual modes
- Combine choosen signals into pattern: AND, OR. Set required number of validated signals to match the pattern
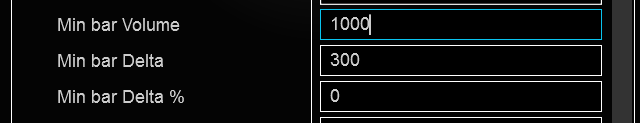
- Volume and Delta filters
- Custom actions for opposite signals: Close, Reverse or None
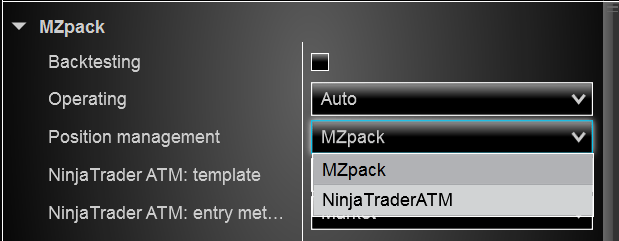
- Advanced orders handling: Custom ATM or NinjaTrader ATM
- Trade, for example, MES contract while running the strategy on full ES contract
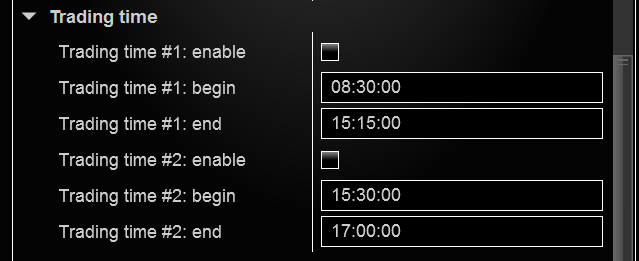
- Time filters: allow the strategy to trade at specific times
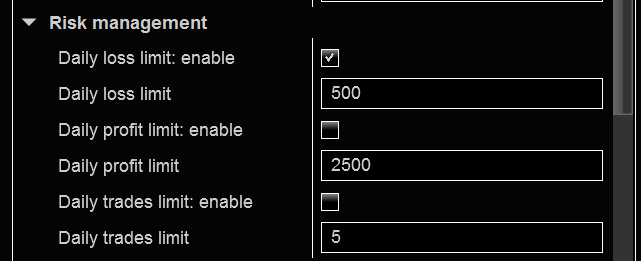
- Daily loss/profit, drawdown filters
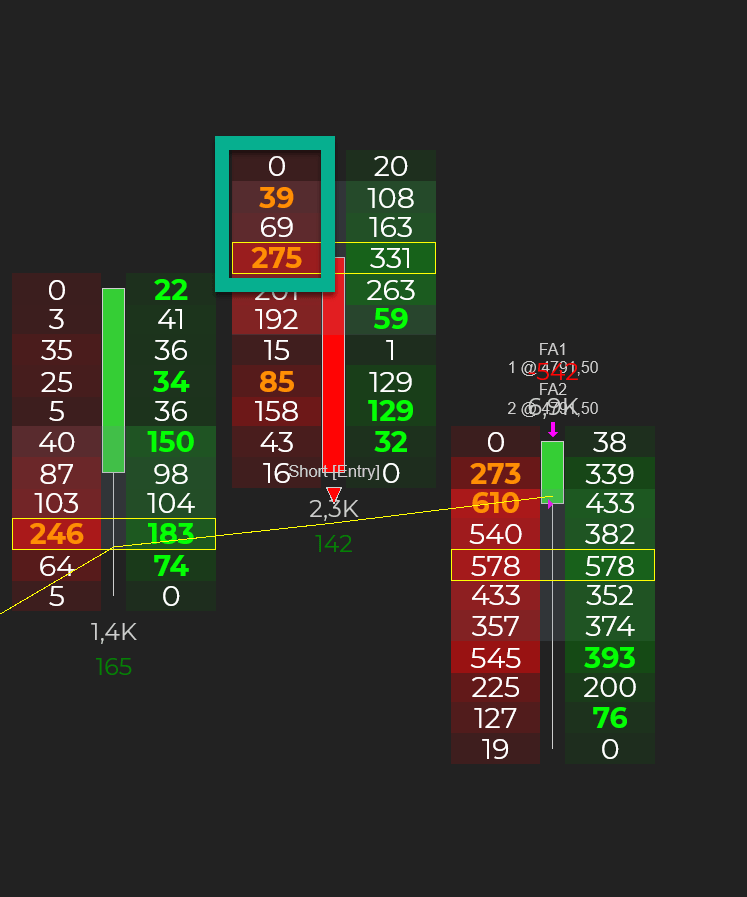
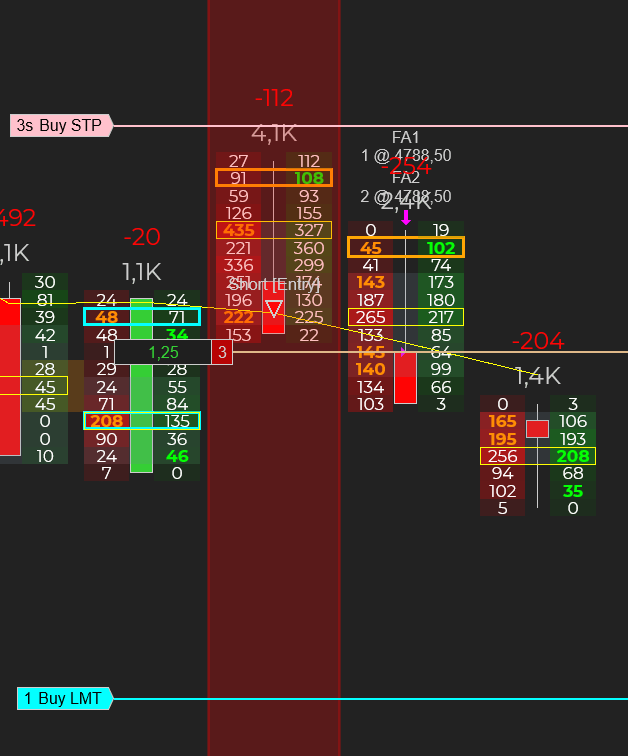
10 Order Flow Signals
- Delta Divergence
- Delta Tail
- Delta Surge/Drop
- Delta Flip
- Delta Trap
- Delta Slingshot
- Above/Below POC
- Stacked Imbalances
- Volume Sequencing
- Hammer with Absorption